

Spiff Releases New Tools To Simplify Analytics, BI and Reporting
Spiff has released a collection of low-code analytics and reporting tools to help corporate finance and sales teams managing commissions. Offerings focus on analytics, custom reports, and benchmarking.
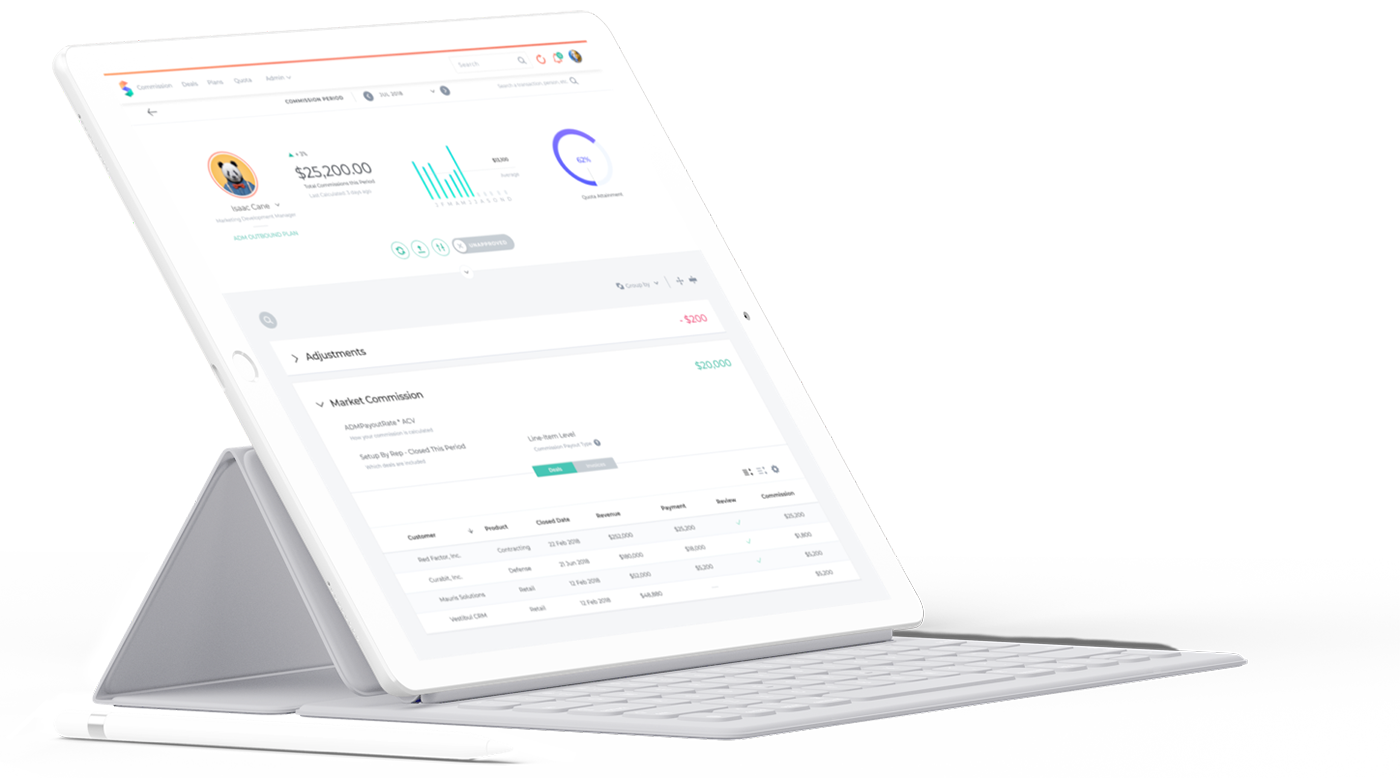
Spiff has released a set of new products that simplify reporting and analytics.
Spiff positions itself as a low-code/no-code commissions solution for companies looking for a spreadsheet replacement to simplify commission tasks and grow with enterprises.
The Spiff offering includes a collection of tools, including Spiff Analytics, Custom Report Builder, Summary Reports and Benchmarking.
Spiff Analytics aims to make it easier for users to understand commission data in real-time, according to Spiff CEO Jeron Paul.
With Spiff Analytics, customers can identify key commissions metrics and reports directly in Spiff or push to an external BI (business intelligence) platform. [For companies that are not using a BI platform for commissions, the custom calculation function empowers users to do complex intelligence functions right in the Spiff platform and share the data across plans and tables.]
Spiff also lets users visualize data and create dashboards with the information they want to see most. And because companies frequently need to manipulate data to create new analyses and reports, Spiff also enables custom calculations.
“We are providing finance and sales teams with reporting that really enables them to go deeper into their data, helping to rebuild the trust between the two teams,” Paul said in a statement.
Spiff Analytics makes it easier to understand commission data in real-time. With Spiff Analytics, customers can Identify key commissions metrics and reports they want pushed to their business intelligence platform or use the reports directly in Spiff.
Additionally, users can visualize data and create dashboards with the information they want to see most. Users are also able to automate the reporting and schedule reports to be sent to others.
Spiff’s latest offerings also support:
Custom Calculations to help companies often need to manipulate data to create new calculations for data analysis and reporting purposes. For companies not using a business intelligence platform for commissions, the custom calculation function empowers users to do complex intelligence functions right in the Spiff platform and share the data across plans and tables.
Custom Report Builder enables administrators and finance users to customize reports and drive data transparency. Users can build their own simplified, custom, and exportable datasheets from data that lives within Spiff. This functionality is ideal for creating simple reports to understand sums, averages, and attainment for a table of records and pulling data into a spreadsheet to do simple analytics.
Enhanced Benchmarking enables an organization to identify how their organizations stack up: Within Benchmarking, users can run visualizations that anonymously compare their company metrics to other companies. This allows organizations to analyze how similarly sized companies or similar roles stack against their team’s performance or easily compare plan complexity versus other companies’ plans. These reports are easily exported.
Summary Reports provide deeper analysis and digestible visualizations. With the new functionality, sales managers now can run visualizations, such as leaderboards, that compare commissions metrics of their team members via the Summary Report functionality. Reports are also easily exported.
Spiff announced $46 million Series B funding earlier this year and claimed top placements in five summer sales compensation reports from G2.com, the largest software marketplace and review platform.


| Upcoming Events Click to Register |
|
|---|---|
| Feb 12, 2026 |
AI Deployment Summit |
| Mar 26, 2026 |
A3 Summit: Apps, Agents & APIs |