

Logz.io’s Prometheus-as-a-Service Cuts Complexity of Managing Metric Data
Logz.io is rolling out “Prometheus-as-a-Service” to remove the burden many DevOps teams face while managing metrics storage. Prometheus users can continue scraping metrics as they do now, and offload to Logz.io’s metrics storage.
Logz.io is extending the power of open source Prometheus infrastructure and cloud monitoring with a new cloud-based managed service storage model.
The company’s Prometheus-as-a-Service aims to eliminate the burden many DevOps teams face of manually managing Prometheus servers and data, while also having to unify their enterprise-wide metrics with logs and traces.
Specifically, with Logz.io’s Prometheus-as-a-Service, engineers can now continue scraping their metrics with Prometheus while offloading the metrics storage to Logz.io, said Asaf Yigal, Logz.io co-founder and vice president for product. This has the added benefit of correlating metrics alongside logs and traces all in one unified observability platform, he said.
“Prometheus is considered the best open source metrics solution in the community. But as users need to maintain more than one Prometheus server, scale it and correlate it with logs, it can become impossible to manage at scale,” Yigal said in a statement.
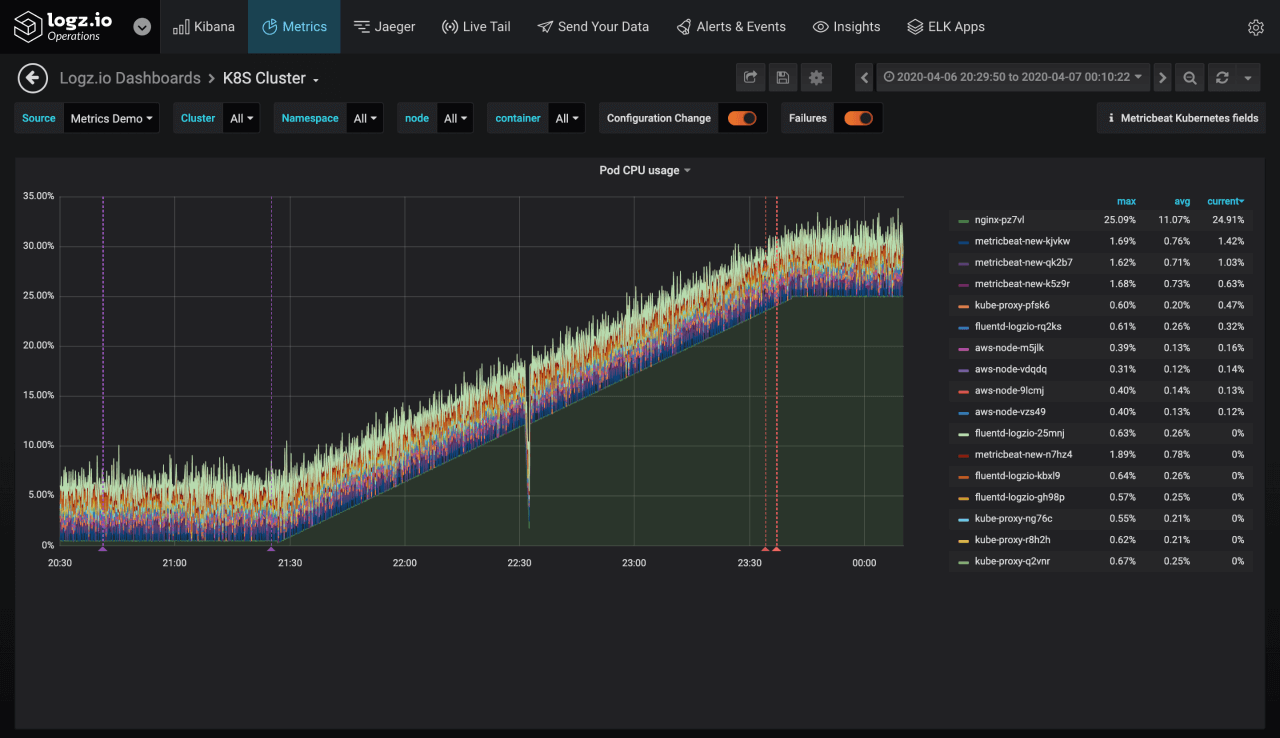
Correlate metric data with recent deployments and give dashboards context by adding Deployment Markers to indicate recent deployments
With Prometheus-as-a-Service, Logz.io aims “to enable our customers with the best of both worlds--a scalable, Prometheus-based offering that significantly enhances the open source vanilla version. And we look forward to seeing how our customers use it to build incredible products,” he added.
In a recent blog post, Logz.io’s executive product manager Roy Nuriel explained the reasons behind Prometheus as a Service – and benefits to users and Logz.io.
The overhead costs of managing modern Prometheus deployments can distract DevOps teams from other core responsibilities. And this is where Prometheus-as-a-service comes in.
Prometheus-as-a-service removes the burden of managing metrics storage while also allowing you to keep your current Prometheus deployment in place. This means you can keep your current Prometheus metrics scraping as it is, and leave the data storage and analytics to us.
Prometheus-as-a-service is the core pillar of [Logz.io’s] Infrastructure Monitoring product, which makes it easy for teams to centralize and analyze their metrics, and configure alerts to monitor for production issues.
From our conversations with hundreds of DevOps teams, it’s clear that Prometheus is the de facto starting point for cloud monitoring. It’s easy to implement and integrate with distributed environments. But we’ve also heard these repeating experiences among Prometheus users:
- Modern Prometheus deployments that store large volumes of metrics for long periods of time can be complex. This can create unwelcome management overhead costs for time-squeezed teams.
- Prometheus is a dedicated metrics monitoring solution. For teams that also need to monitor their logs and traces for full observability, they’ll need separate and siloed tools. This means more systems to manage and disconnected or slower troubleshooting.
Prometheus-as-a-service centralizes your Prometheus metrics on Logz.io’s scalable cloud platform for storage and analysis. Teams can continue using their existing Prometheus metrics scraping capabilities while eliminating the burdens of metrics storage and siloed monitoring data.
In specific, Logz.io’s Prometheus as a Service includes these notable features:
- Ability to correlate logs, metrics and traces for accurate incident detection and investigation
- Easy migration from Prometheus to Logz.io
- Out-of-the-box advanced dashboards
- Alerts that can combine both logs and metrics to identify and notify of production issues
- Option to add annotations to overlay production events over metrics visualizations
- Sub Accounts to provide the Role-Based Access Control
- Ability to use the best-of-breed open source for logs, metrics, and traces side-by-side on a fully managed platform.
Also speaking on the benefits of Logz.io’s Prometheus-as-a-Service was Daniel Seravalli, lead engineer at Holler, a “conversational media” firm focused on creating and delivering content that helps peer-to-peer messages and a big user of Prometheus.
“We find a lot of value in using Prometheus to provide metrics and insights into our cloud infrastructure, Kubernetes clusters, application performance and beyond, but attempting to run a Prometheus time-series database at scale can be incredibly time-consuming,” Seravalli said in a statement. “Thankfully, Logz.io helps alleviate this for us by running Prometheus at scale and providing the expertise and support needed to simplify management of the metrics backend.”
Speaking of customers, to get started, Prometheus users can now easily send their metrics to Logz.io’s Prometheus-as-a-Service by adding just a few lines of code to their configuration files. Users can also easily import all their dashboards to Logz.io and complete the migration in just minutes, Yigal added.


| Upcoming Events Click to Register |
|
|---|---|
| Mar 26, 2026 |
A3 Summit: Apps, Agents & APIs |
| May 7, 2026 |
AI Deployment Summit |
| Jun 18, 2026 |
Re:Imagine the Enterprise! |