

Tableau Looks To Promote ‘Analytics-at-Scale’ with Updates for AI, NLP, Self-Service and More 
During its 2019 user conference, Tableau showed how its latest data analytics platform updates will help companies adopt analytics-at-scale. IDN talks with Tableau vice president Mark Nelson about innovations with self-service, data management, NLP and even AI.
by Vance McCarthy
Tags: AI, BI, cloud, data prep, NLP, self-service, Tableau, visualization,

executive vp of product development
"Everyone is talking about gathering data for analytics. But studies show only 8% have effectively done it at scale."

During its 2019 user conference, Tableau rolled out updates to its popular data analytics platform aimed at helping firms better adopt analytics-at-scale.
Tableau’s latest innovations range across self-service, smart data management, NLP (natural language processing) and even AI.
Collectively, Tableau’s latest technologies look to help companies encourage more employees – not merely trained data analysts -- to use data and analytics, Tableau’s Mark Nelson, executive vice president of product development told IDN.
“Everyone is talking about data and gathering data for analytics. But right now studies show that only 8% have effectively done it at scale,” Nelson told IDN. “Despite desire and great tools, many companies are struggling.”
With its latest updates, Tableau’s goal, Nelson said, is to expand access to analytics beyond traditional users (e.g., data scientists and business analysts) to even more and varied types of users.
Expanding the data culture to more players will often bring value to the business ways not often thought of, he said. “It’s about getting entire culture and organization to think about data,” he added.
This broader ‘analytics-at-scale’ way of thinking, Nelson said, involves techniques that will improve the impact of data and analytics on the business, customers and partners.
Among them, Tableau is focusing on several innovative ways to:
- Empower more users to make data-based decisions
- Make more data available faster and to more users via streamlined data prep
- Explore new ways of offering smart ‘self-service’ for data queries
- Provide more users easier and ready-access to data
- Gather data with ‘operational’ use in mind (not merely use once and archive) and
- Treat data to provide answers to queries faster Put data in locations and formats so that as many people as possible can use it for their experimentation
Nelson pointed to several key pillars of technology Tableau debuted last month to deliver these benefits.
Smart Self-Service Data Management via Tableau Catalog, Prep and More
To help users get a complete view of trusted data, Tableau Catalog provides a much more in-depth look at data and its relationships to other data – all in a self-service way.
“Everyone loves self-service,” Nelson said, adding Tableau’s approach to self-service is to answer an increasingly vexing question for data users:
“How do you get that balance between [data availability] and trust in governance
that lets users create things and understand what is becoming the key data.”
Once users can do this -- through data access, data understanding and experimentation, they can leverage widely varied data from all across the company. This means long-governed data warehouses, data lakes and even individual worker laptops can be valuable to analytics projects because governance can be applied, as needed.
“You have a huge expansion in trusted data sources. Once you find data that is valuable, no matter where it is, we can help you can put governance around it,” Nelson added.
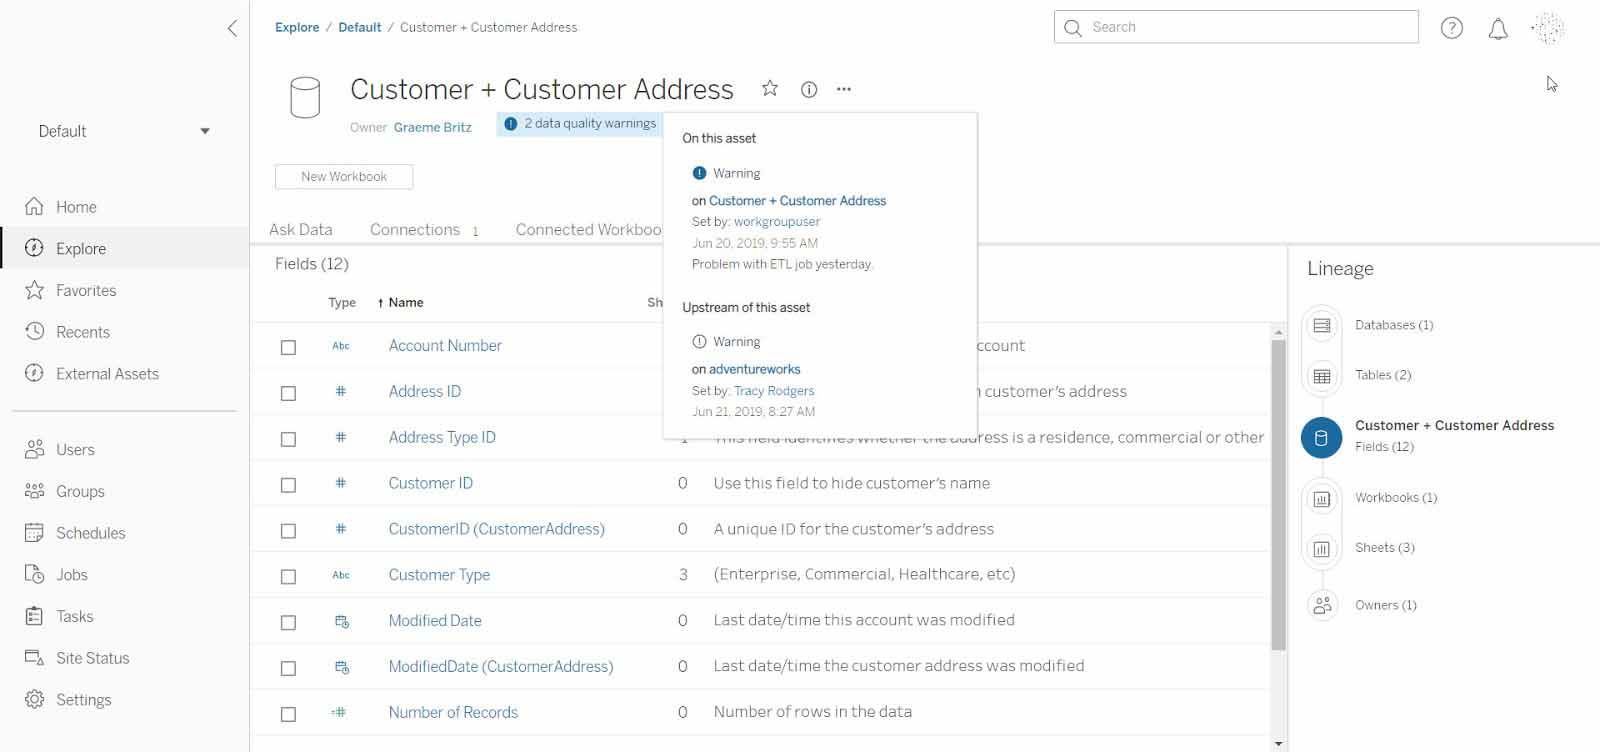
With Tableau Catalogue, users can view details such as usage metrics, lineage, and impact analysis. This helps data users and IT better understand how data is used, where it relates (or is inter-dependent), and perhaps most importantly, when data changes will impact outcomes, dashboard views and so on.
“The unique thing is really giving you a window into all this data. What’s being used? Are they going to your data warehouse or random laptop apps? It’s amazing visibility,” Nelson said.
During operations, Tableau Catalog provides all users with an enhanced search to find the right data to connect to, but it also gives everyone more visibility into the data they are analyzing, in context "whether viewing a dashboard or web authoring a viz," Tableau said.
The self-service power of Tableau Catalogue comes from the fact there are no indexing schedules to set, and no need to configure connectivity. The catalog automatically maps to existing Tableau Server permissions.
The Tableau blog also described how Tableau Catalog builds company-wide trust in data with visibility, alongside other data control features.
Data quality warnings provide users with indications of any issues with data being used in a dashboard, like a missing field or a maintenance interruption. Data owners can also add definitions and additional metadata, so users have a better understanding of the data itself. When someone creates and publishes a dashboard that uses the data source, they can see these data details in a sidebar, making it easy for everyone to feel confident in their analysis.
Relatedly, Tableau also announced updates coming for its Tableau Prep offering for self-service data preparation. Tableau Prep offers end users a way to visually combine, shape and clean data. It sports components to let users build their data flows directly, as well as schedule, monitor and manage those flows across the business.
“We are not trying to be a full-blown ETL tool or trying to replace our partners,” Nelson said. “We are simply trying to make it easy for users who don’t need a full-blown ETL to just do what they need to do - and not have to wait a month. It’s a very easy interface. And, we think it will address a huge hunger out there for this type of self-service, and I can’t wait to see the impact.”
Nelson expects early use cases will include “basic data cleanliness, strings in number fields, normalization of city/state names and so on.”
But he also mentioned a more exciting possibility for sophisticated users. “They can do Python integration with their own models so they can pass a dataset through their own script to generate their own data set through model or code they’ve written. This means they can play with their [project] before they publish it for everyone to use.”
Tableau Catalog and Tableau Prep Conductor are among the components in Tableau’s Data Management Add-On. With an eye to provide for more data management.
The company also unveiled a Tableau Server Management Add-On. This adds features for Resource Monitoring, Content Migration, External Repository Hosting ( for Improved Scalability) and AWS Key Management Service Integration for data extract encryption at rest.
Tableau ‘Ask Data’ Understands User Intent with NLP
Tableau’s Ask Data lets users speak a question and get a direct response right from within Tableau. Ask Data, which Nelson said, “enables more users to ask questions of data than ever before using NLP.”
Notably, Nelson said that Ask Data understands the context of the query or question – and infer user intent.
Customers can type a question such as, “What were my sales this month?, “and Tableau will return an interactive visualization with no need to learn data dimensions, measures, or any data structure. Ask Data uses sophisticated algorithms that are driven by an understanding of the person’s intent, not keywords, which helps Tableau understand a person’s question, anticipate needs, and allow for smart visualization selection.
Ask Data provides some common built-in synonyms for these concepts, like “from largest” for descending order and “mean” for average. It can also understand concepts such as “starts in,” “‘ends in,” and “between.” It also supports relative time concepts such as “last 3 years,” “next quarter,” “this month,” “today,” and “yesterday.”
As a real use case, Ask Data could report a company’s profit over a period of time by interpreting the word “profit” as a sum over a time period (such as order date) from the available data.
Tableau’s website provides some extra under-the-covers insight about how Ask Data works to ‘understand’ people’s questions:
Ask Data leverages context to determine the attributes of the relevant data type, breaking utterances into tokens—phrases containing temporal, spatial, or numerical expressions—to understand intent. It then uses visual best practices to determine the most appropriate visualization to satisfy the user’s intent.
Let’s say someone wants to ask questions of a published data source containing year-to-date sales. They can type a question like “what is the profit over time?” into the Ask Data input box. In this case, Ask Data resolves the user’s intent by aggregating “Profit” as a sum—the default aggregation. It also resolves the intent of “time” to the attribute “Order Date” in the data source, aggregated at its year level.
The Ask Data ‘answers’ come as rich data visualizations -- without the need for Tableau to understand any of the complex structures of the data. “Ask Data provides better visualizations and easier ways for users to share analytics,” Nelson said. It also provides the answers faster, he added.
Ask Data's updated capabilities arise from NLP technologies that focus on the intersection of language and visualization. It is based on ClearGraph, which Tableau acquired.
Tableau’s ‘Explain Data’ Taps AI To Reveal the ‘Why’ of Results
Another reveal from Tableau was ‘Explain Data,’ a feature that helps users make sense of their data, especially when outliers may distort results.
All data analysts have run into the situation where a result is super-surprising – or worse, doesn’t make sense at first look. What’s even more annoying is that is can be a laborious task to track down the exact cause and do a recalculation, if necessary.
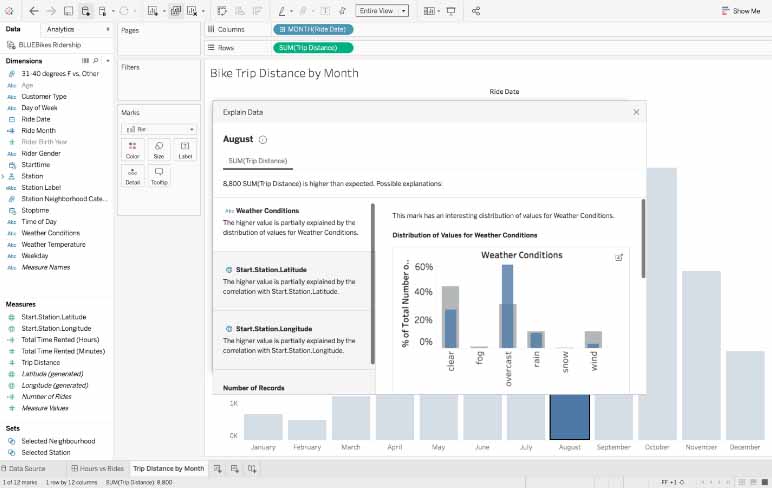
Explain Data helps avoid these confusing results by leveraging AI to explain specific points in data, Nelson said. “Tableau uses powerful Bayesian statistical methods to generate explanations. We look for correlation and look for data outliers,” he said. Based on advanced statistical models, the user is presented a focused set of explanations. This operation lets users find outliers – and thereby, they can avoid spending time making sense of data that may not make sense at first blush.
Technologically, Explain Data automatically provides AI-driven explanations behind your selected value. Behind the scenes, hundreds of potential explanations are checked and the most likely ones are surfaced.
Nelson shared an example where a user was looking for average gas mileage of cars by state. Their result showed that Montana autos had the best miles-per-gallon – by an extensive margin. It turns out there was an entry that stated a vehicle has 6500 miles per gallon. “That is the type of outlier Explain Data can find very quickly,” he said.
A Tableau blog post on Explain Data describes how it works for users this way:
“When you create a viz, simply select a mark and start using Explain Data from the tooltip. Behind the scenes, Explain Data evaluates hundreds of potential explanations and delivers the most likely ones as a combination of visualizations and text descriptions. From there, you can explore them further with the full power of Tableau. With Explain Data, you can identify causes and see relationships you didn’t know existed.”
Tableau Blueprint – Bringing It All Together for ‘Analytics at Scale’
To help users bring the technologies and practices together into an ‘analytics-at-scale’ enterprise, Tableau also revealed a Tableau Blueprint.
“Blueprint is not how to implement Tableau guide; we’ve had that forever. Tableau Blueprint is where you set up a culture where your organization can want to use data at every stage. So, Blueprint is what you need to set up in your organization that way.
In specific, Tableau Blueprint includes curated Tableau best practices and the expertise from thousands of Tableau customers, according to the company. The result Is an easy-to-follow methodology that aims to help users “turn repeatable processes into core capabilities and become a data-driven organization,” according to the Blueprint website. It covers various topics and disciplines, including Strategy & Teams, Governance, Agility, Proficiency and Community.
Tableau is offering a cloud-centric blueprint for analytics. It expanded its strategic relationship with Amazon Web Services on a new initiative, Modern Cloud Analytics. MCA is aimed at helping customers unlock the power and flexibility of self-service analytics in the cloud, the companies said.
MCA will leverage the analytics and cloud expertise of both firms to provide a blueprint for migrating their analytics to the cloud.
Related:
- SolarWinds Brings “Resilience’ to IT Ops for Agentic AI and Autonomous Operations
- Tray Enterprise-Class AI Platform Casts Light on “Shadow MCP” and Controls “AI Sprawl”
- Xano 2.0 Updates Production Grade Backend for AI, Apps To Solve "Vibe Coding Trap"
- Ai4 2025 Vegas Wrap-Up: What Enterprises Need to Know About Emerging AI Solutions
- Boomi Agentstudio Looks To Deliver Full-Featured Management Platform for AI Agents
All rights reserved © 2025 Enterprise Integration News, Inc.